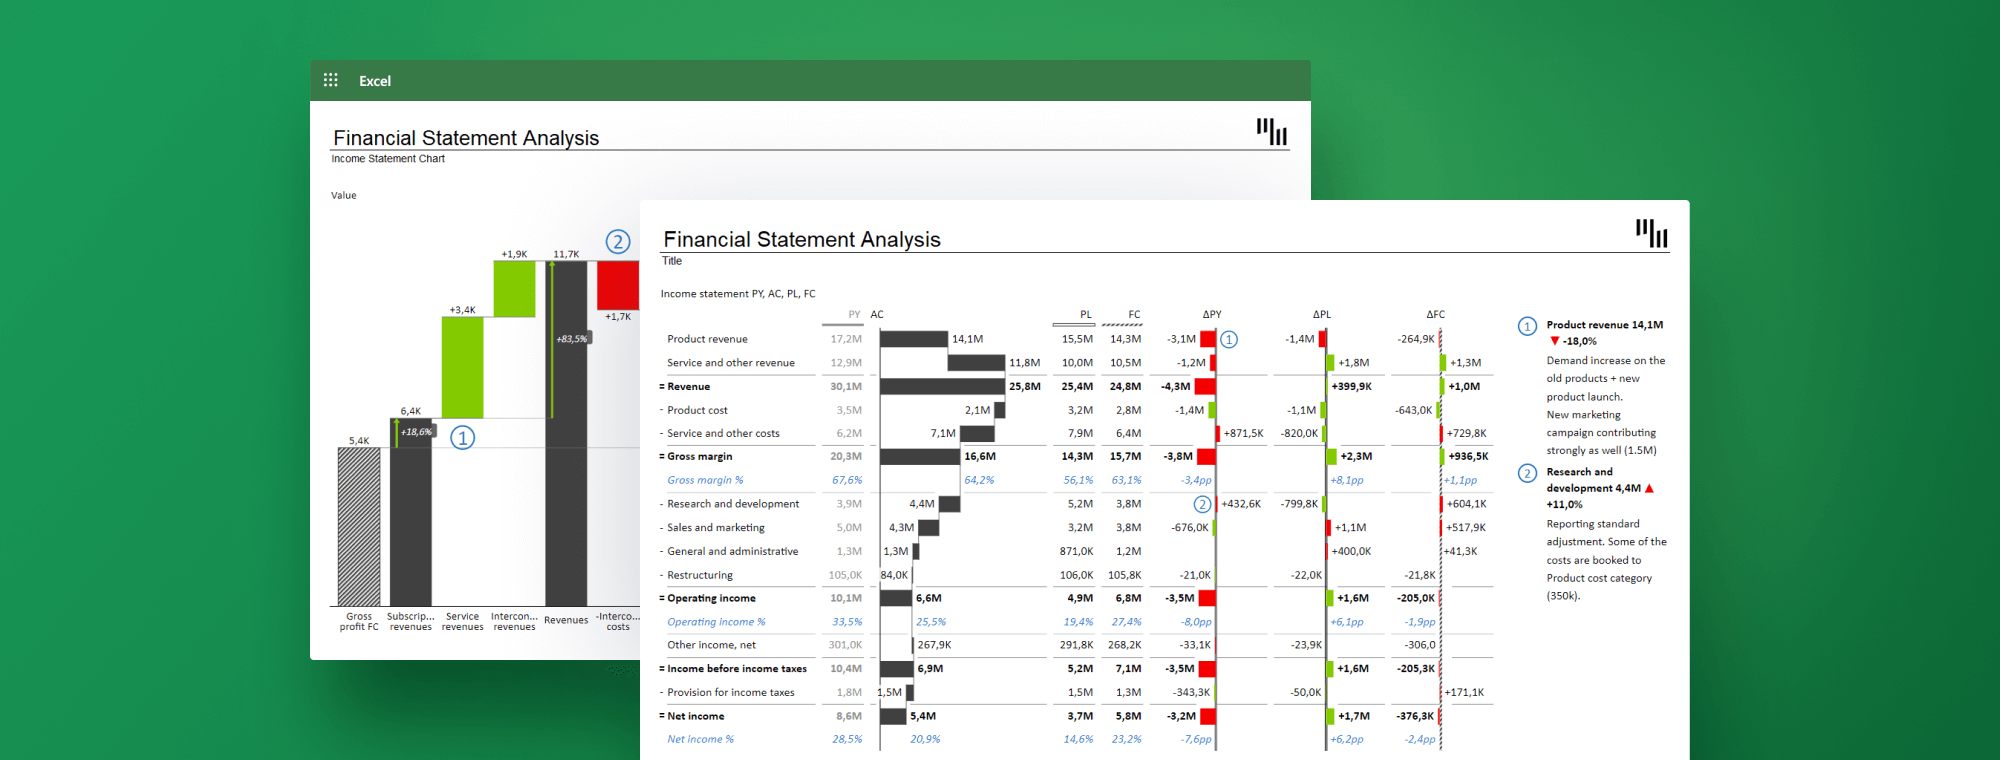
If you’re embroiled in the intricate world of financial analysis, you already know that Microsoft Excel is your closest companion. In this tutorial we will walk you through easy steps to learn how to use MS Excel for Financial Analysis.
One day 1 hour
From creating pivot tables to harnessing the power of advanced formulas, this guide will offer you a step-by-step tutorial on how to utilise Excel for in-depth financial analysis.
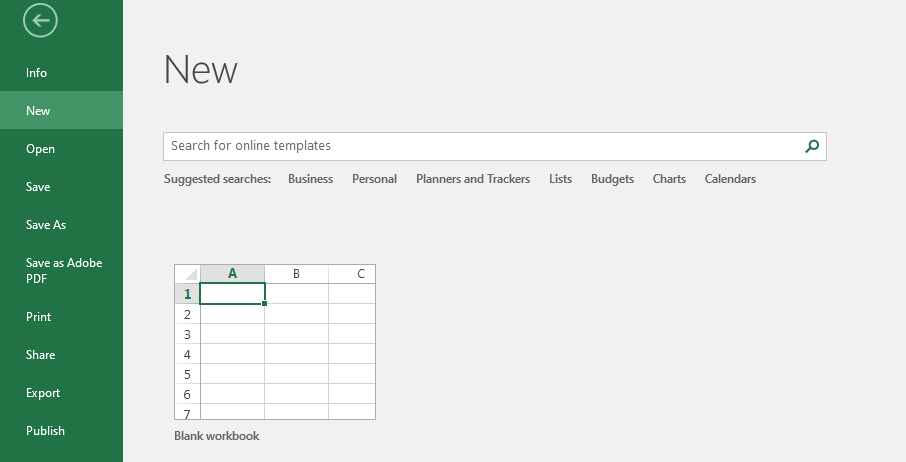
- Open a New Workbook
Launch Microsoft Excel and open a new, blank workbook to start your financial analysis project.
- Navigate to Data Tab
Click on the
Datatab in the top menu to reveal a drop-down.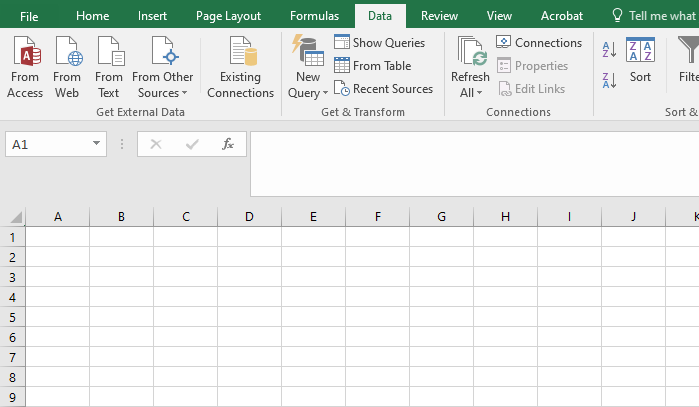
- Import Data
Click on
Get Datato select the source of your financial data. Excel supports several file types including .CSV, .TXT, and SQL databases.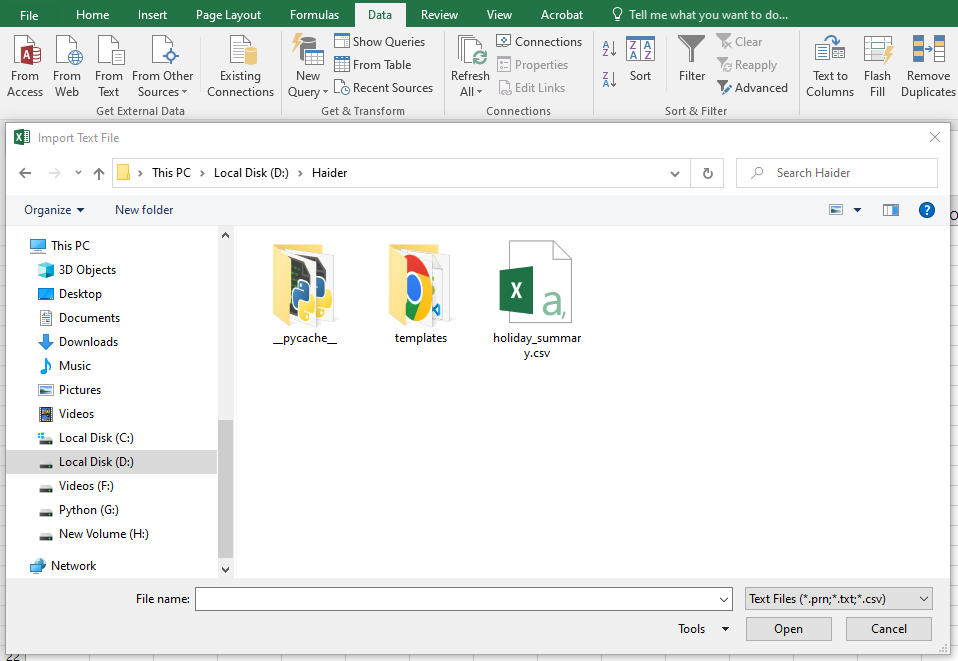
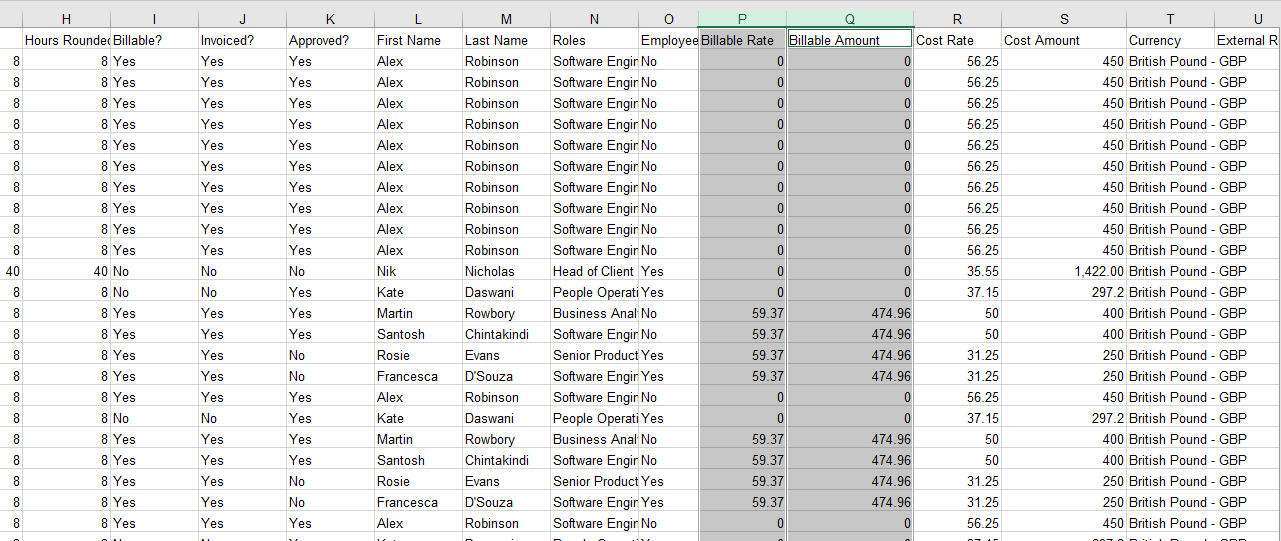
- Organise Data
Once imported, organise your columns and rows in a coherent manner to make analysis easier. Use the
SortandFilteroptions for better data management.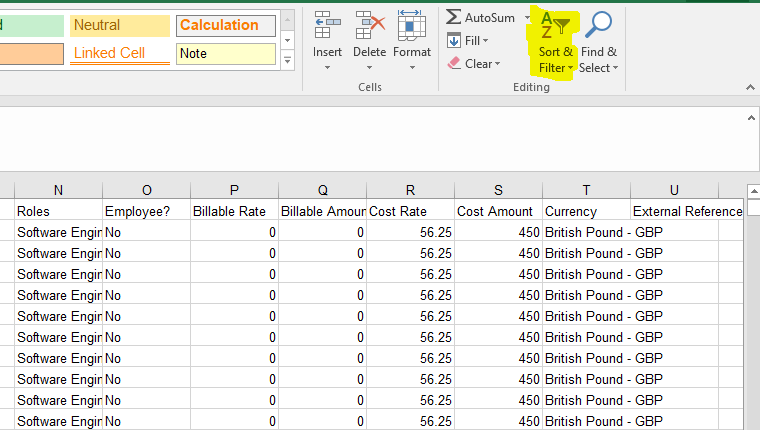
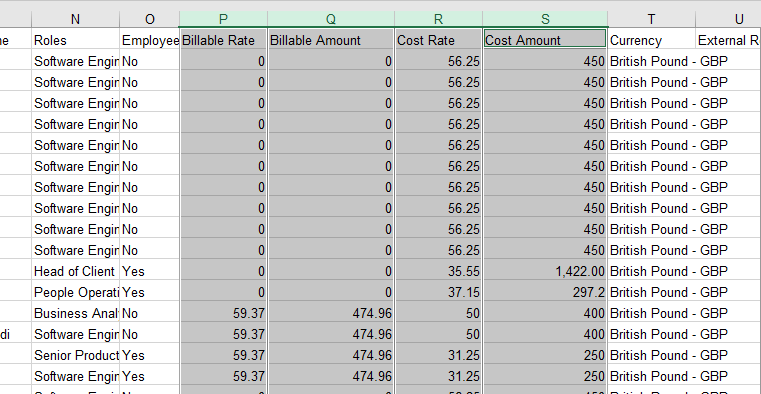
- Select Your Data Range
Highlight the cells containing the financial data you wish to analyse.
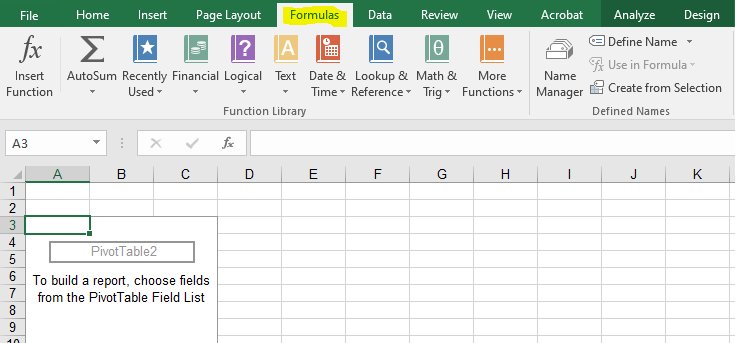
- Insert Pivot Table
Navigate to
Insertand then selectPivotTable. A dialog box will appear. Confirm your selected range and choose where you want the Pivot Table to be placed.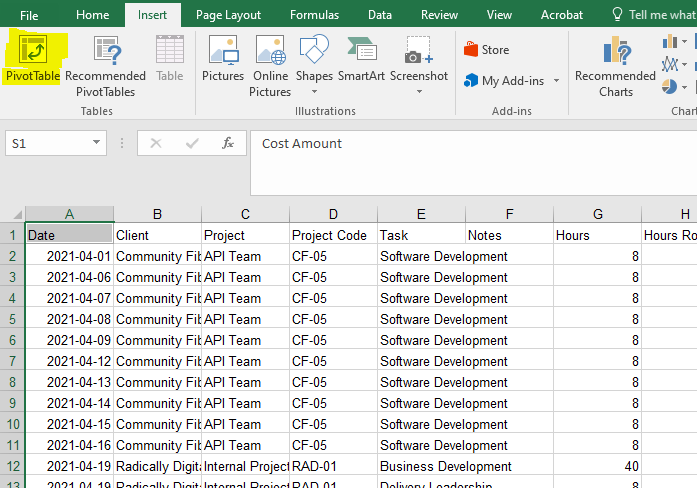
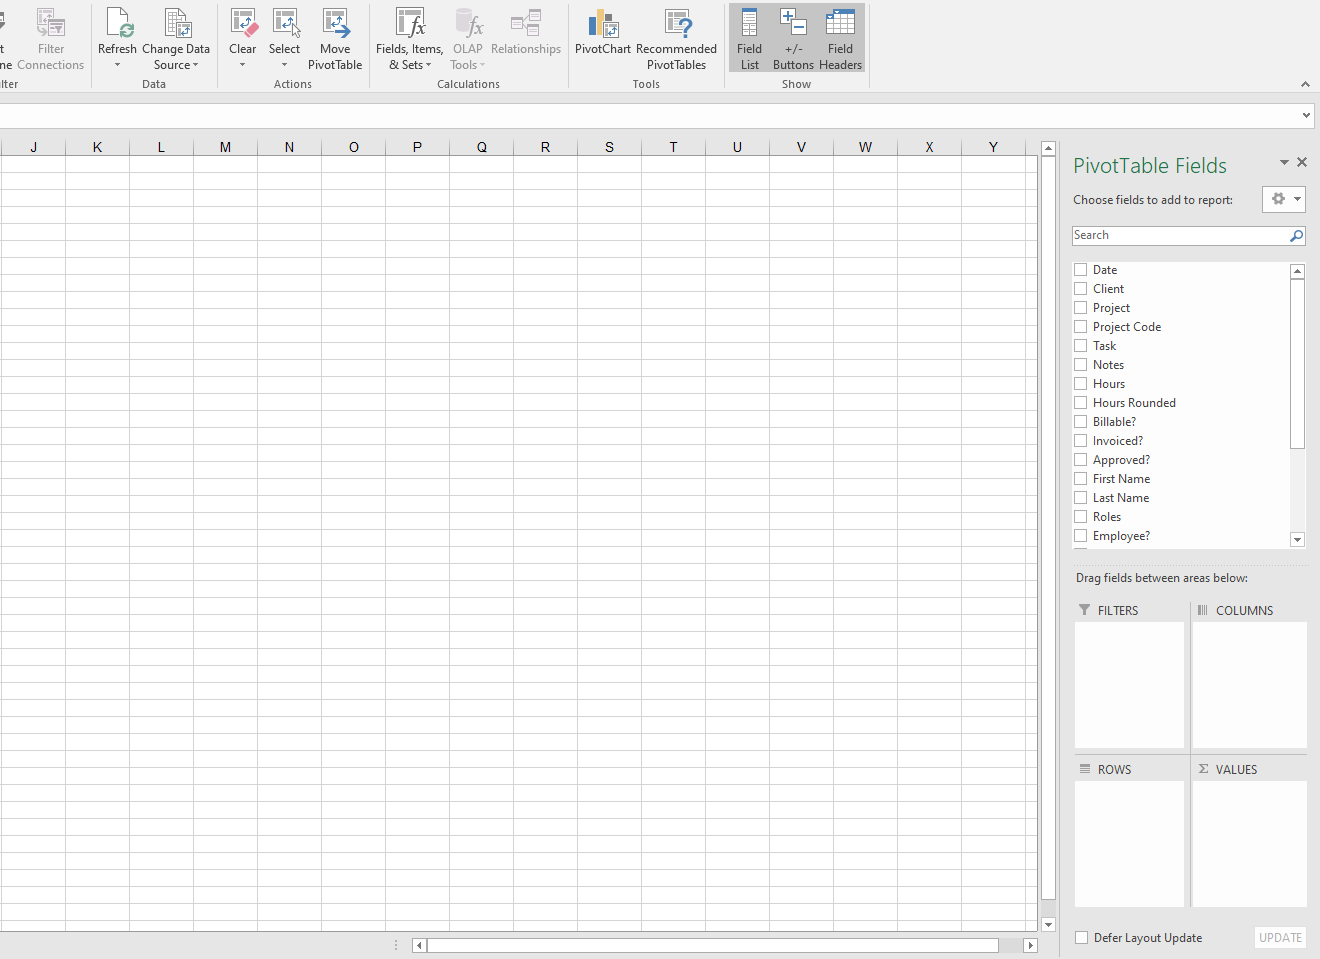
- Build Your Table
Drag and drop fields into the ‘Rows’, ‘Columns’, and ‘Values’ areas to construct your table. Pivot tables can help you with various financial metrics like sums, averages, and counts.
- Understand Basic Financial Formulas
Begin with basic financial formulas like SUM, AVERAGE, and COUNT.
- Use Advanced Formulas
For deeper analysis, use advanced formulas such as
NPVfor Net Present Value,IRRfor Internal Rate of Return, andXNPVfor non-periodic cash flows. To insert these, type “=” followed by the formula name in a cell.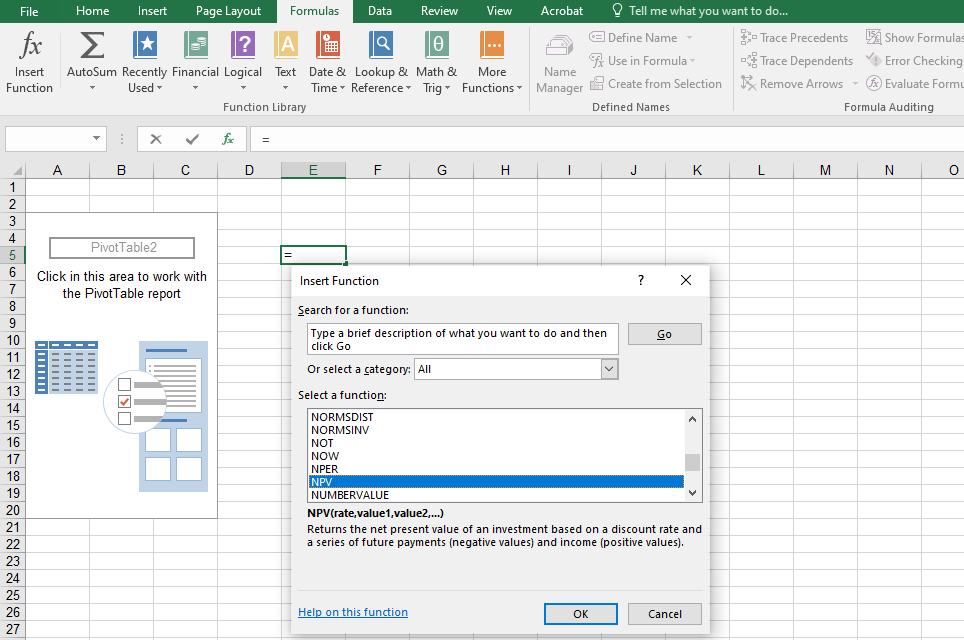
- Highlight Data
Select the data you want to visualise.
- Choose Chart Type
Go to the
Inserttab and select the type of chart that best represents your data. Line and bar charts are often used in financial analysis.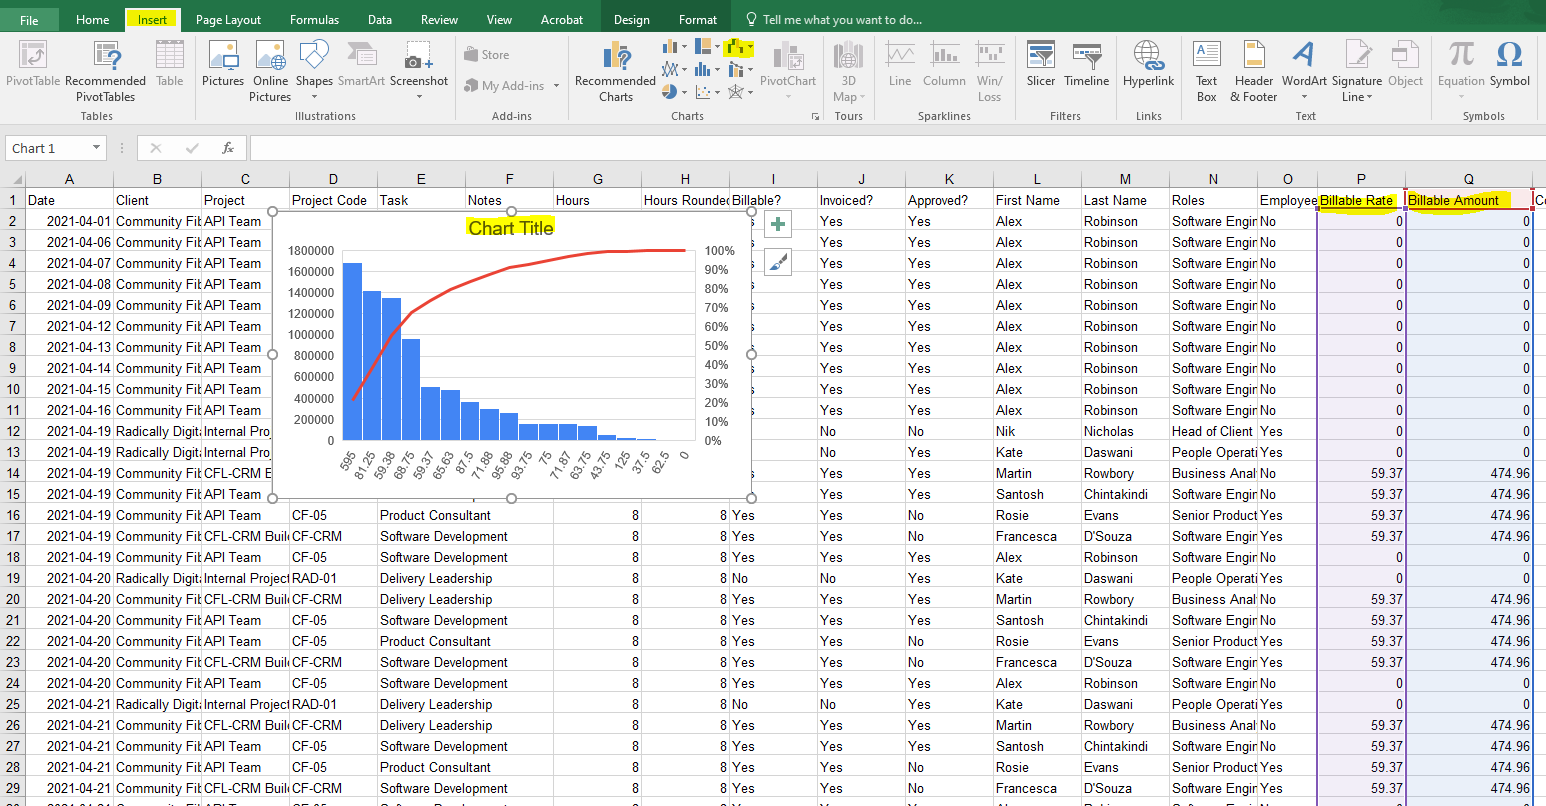
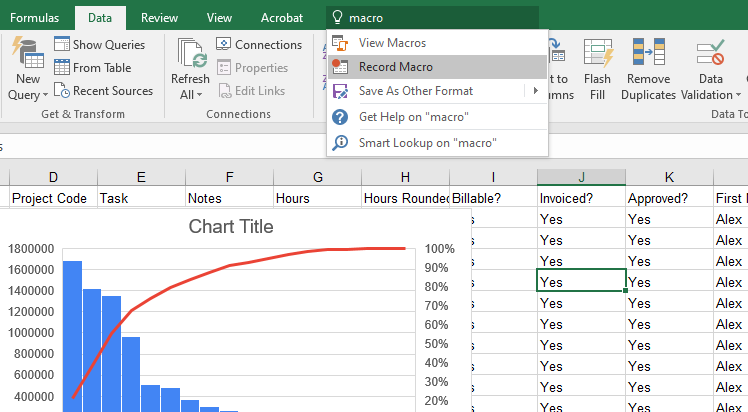
- Create Macros
For repetitive tasks, record or code macros using VBA (Visual Basic for Applications).
- Install Required Libraries
For advanced analysis, install Python on your local machine. Open Python and install required libraries. You’ll need Python libraries like
xlwingsorpandas.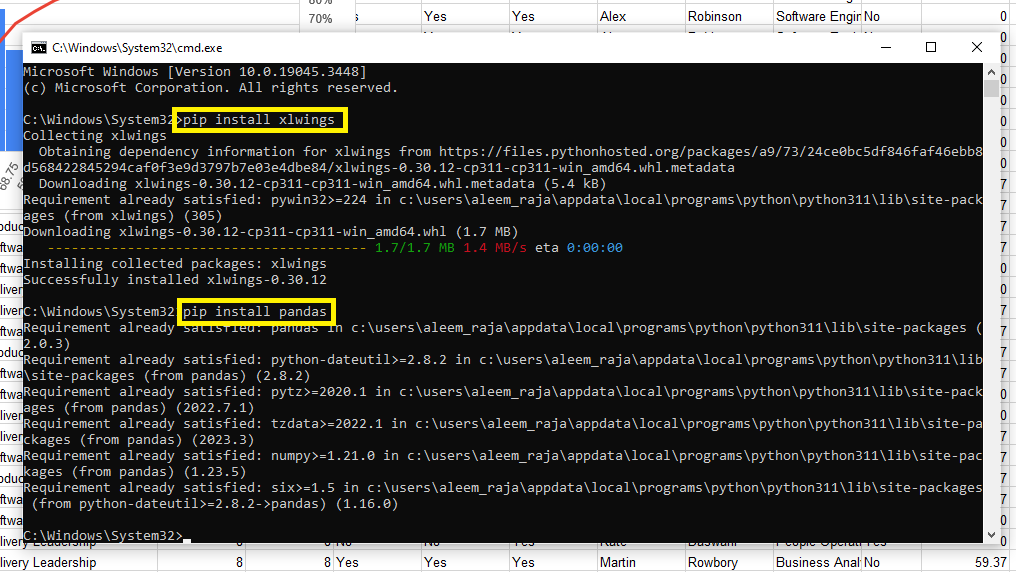
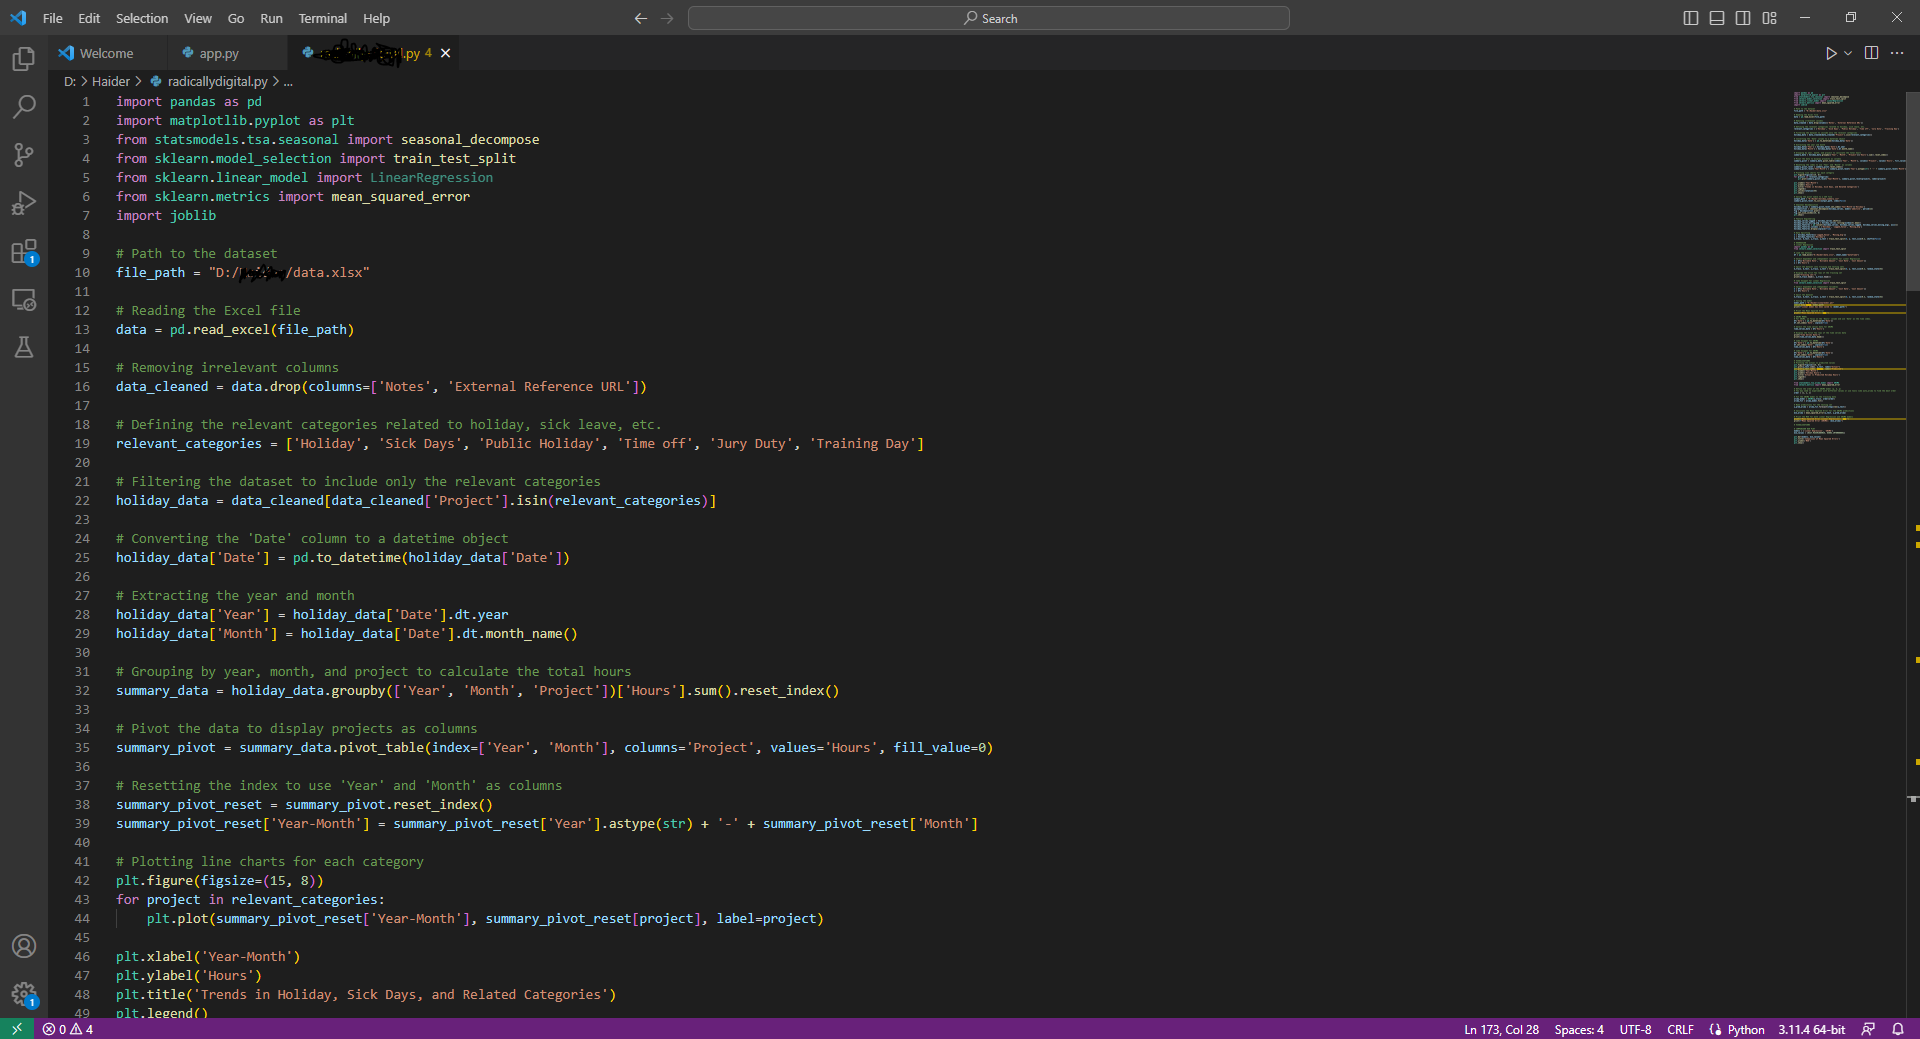
- Write Python Code
Create Python scripts to run advanced data analytics directly within Excel.
Conclusion
By mastering these steps, you can elevate your skills in financial analysis using Microsoft Excel. Whether it’s basic calculations or complex financial modelling, Excel serves as a comprehensive tool for all your financial analysis needs.
If you require further specialised guidance or have complex financial analysis needs, please don’t hesitate to contact us. Our ProScholars are here to assist you related to your project.