IBM SPSS (Statistical Package for the Social Sciences) is a robust software tool employed by researchers across various disciplines. Renowned for its comprehensive suite of statistical tools, SPSS allows users to perform intricate data analysis, making it a favourite among academic circles.
Time needed: 6 hours
In this tutorial, we will explore how to effectively harness the power of SPSS for your research projects.
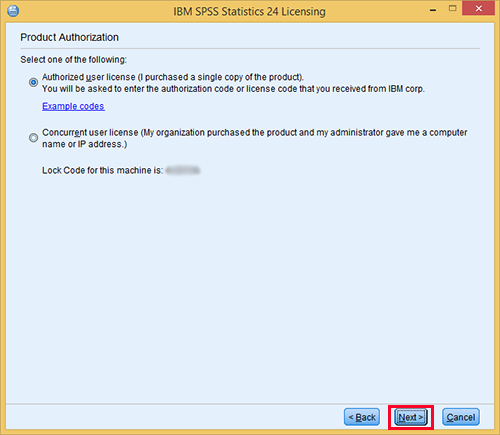
- Purchase or Acquire a License
To use SPSS, you will either need to purchase the software or obtain a license through your academic institution.
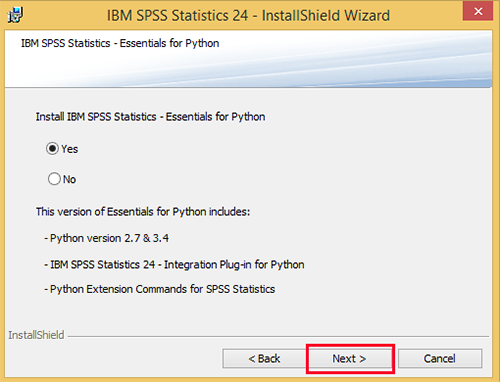
- Download and Install
Visit the official IBM website, download the relevant version of SPSS, and follow the installation prompts.
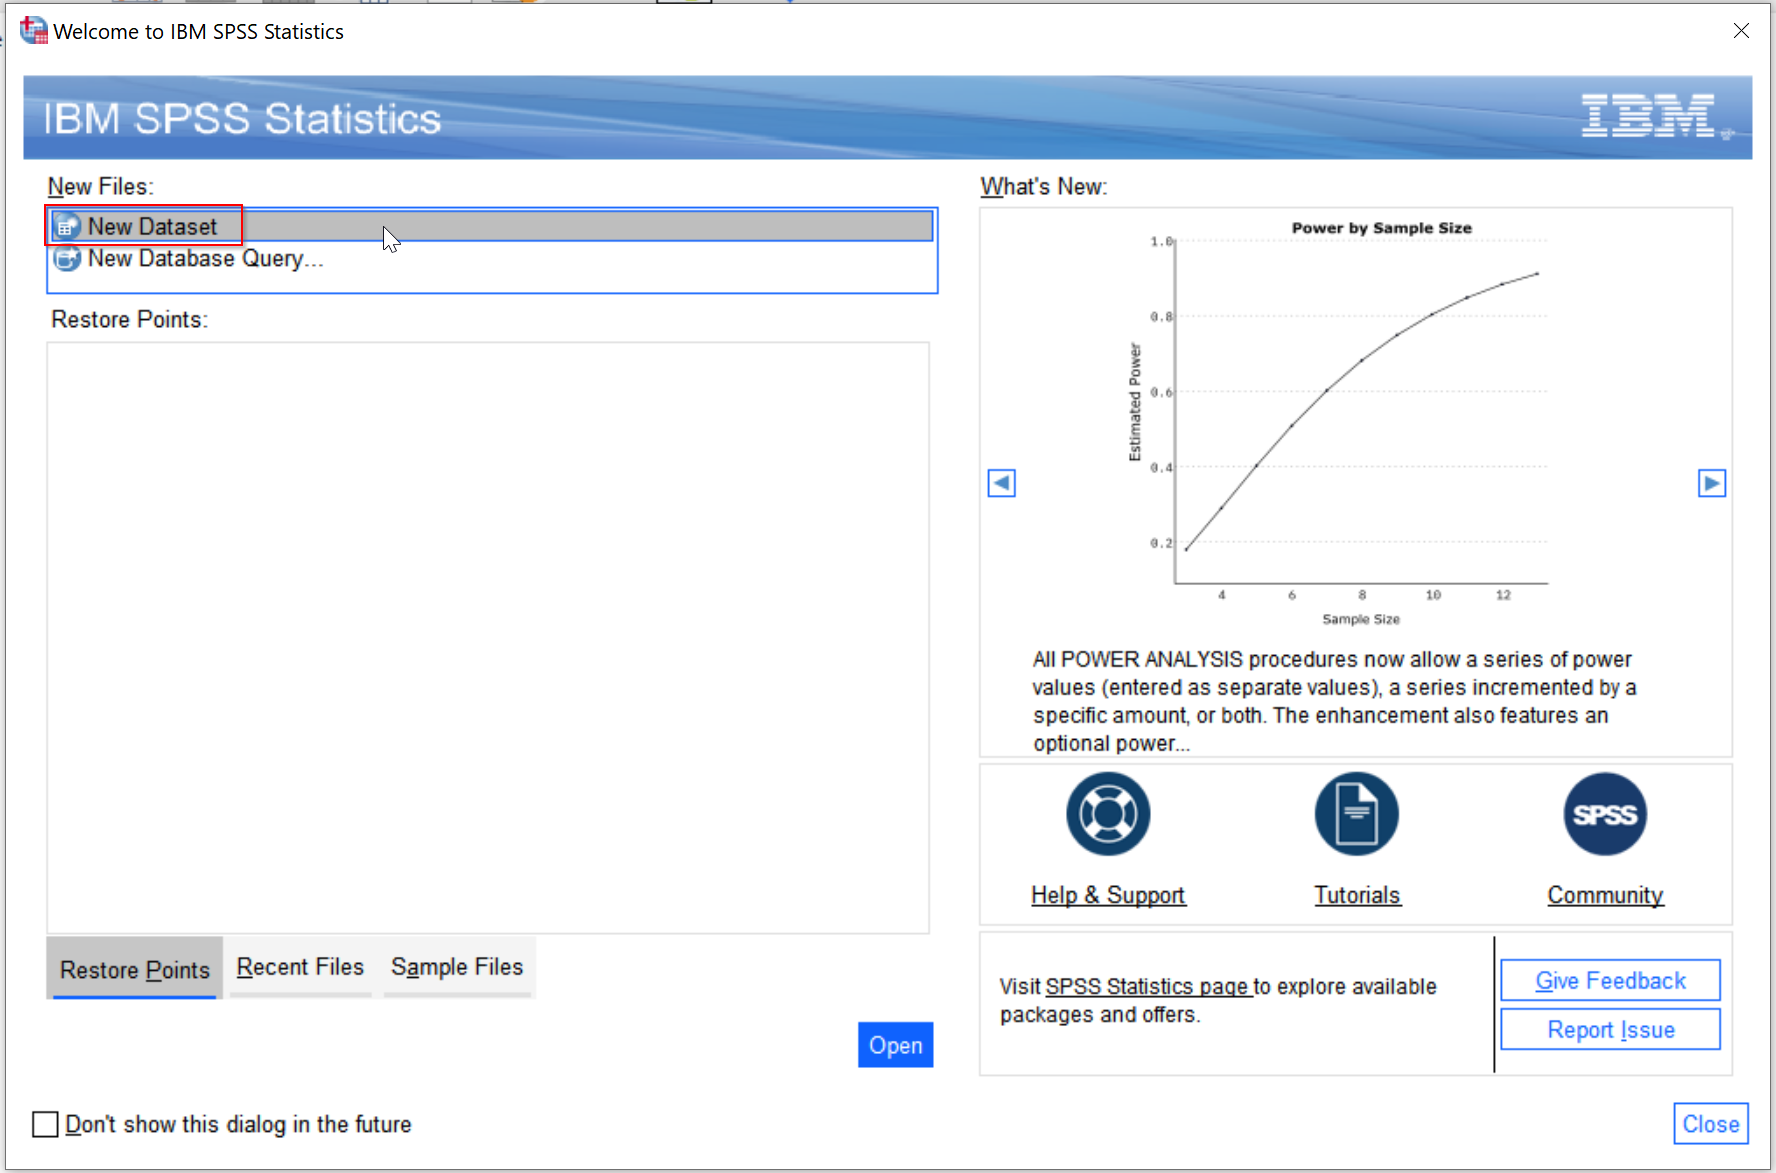
- Launch SPSS
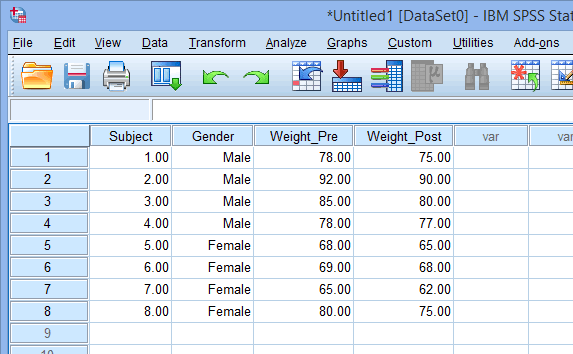
Upon launching SPSS, you’ll be greeted by a data editor resembling a spreadsheet.
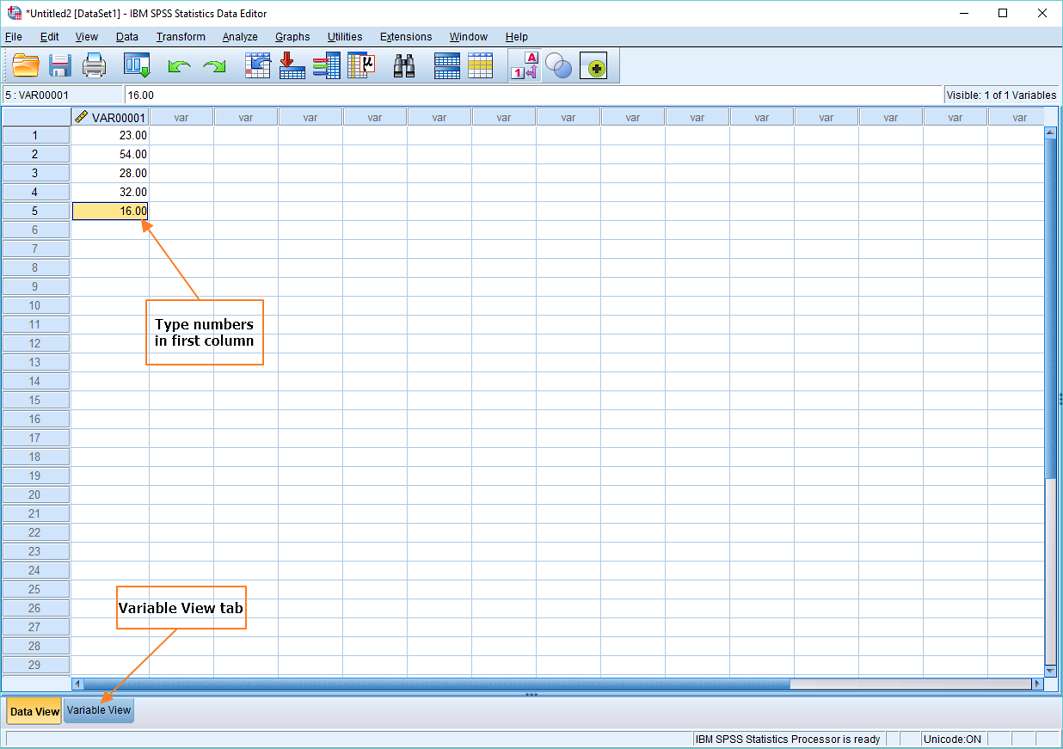
- Inputting Data
Manually enter data or import from Excel or other compatible sources. Each row represents a case, while columns (or variables) might be factors like age, gender, or test scores.
- Define Variables
Go to the ‘Variable View’ tab to define the characteristics of your variables, such as type, width, and label.
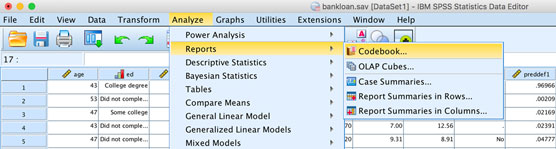
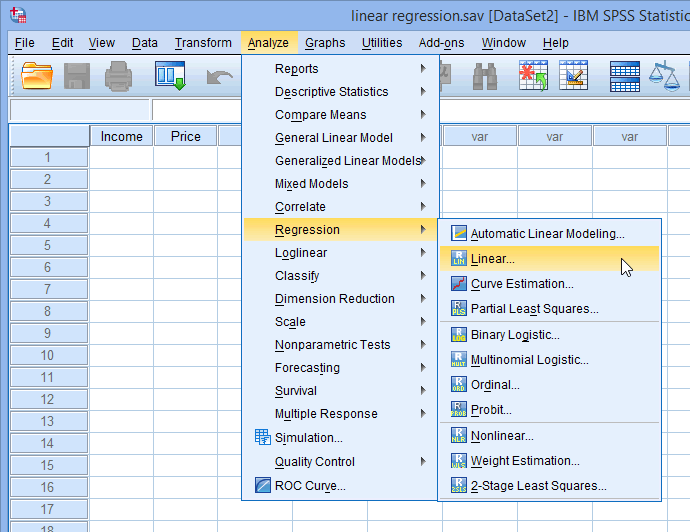
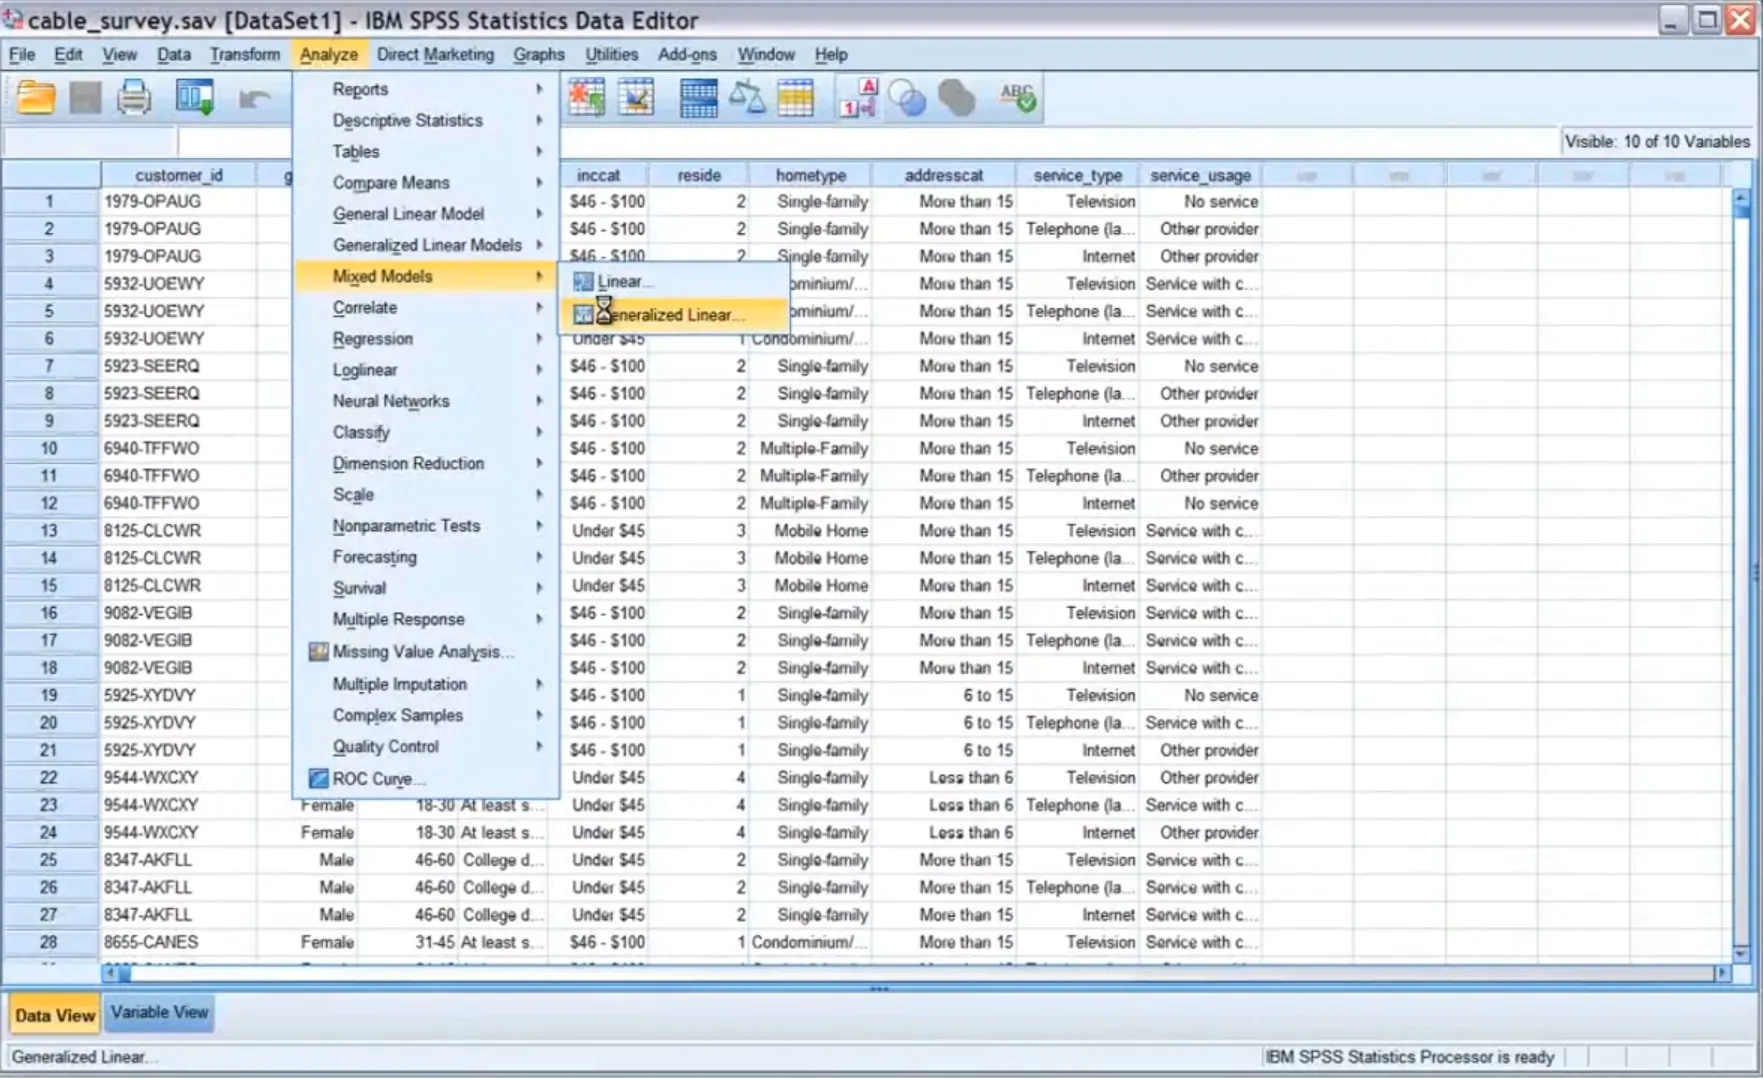
- Navigate to ‘Analyze’
From the top menu, select ‘Analyze’, then choose your desired test, like ‘Descriptive Statistics’ or ‘Frequencies’ depending upon the need of your SPSS data analysis project.
- Select Variables
Choose the variables you wish to analyse and move them to the active box.
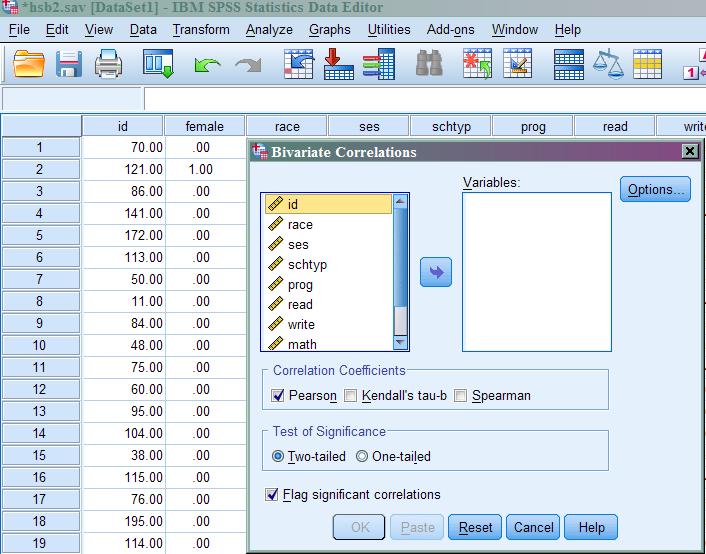
- Run Analysis
Click ‘OK’ to run the test. Results will appear in the SPSS output window.
- Go to ‘Graphs’
Select ‘Graphs’ from the menu, and choose between options like bar charts, histograms, or pie charts.
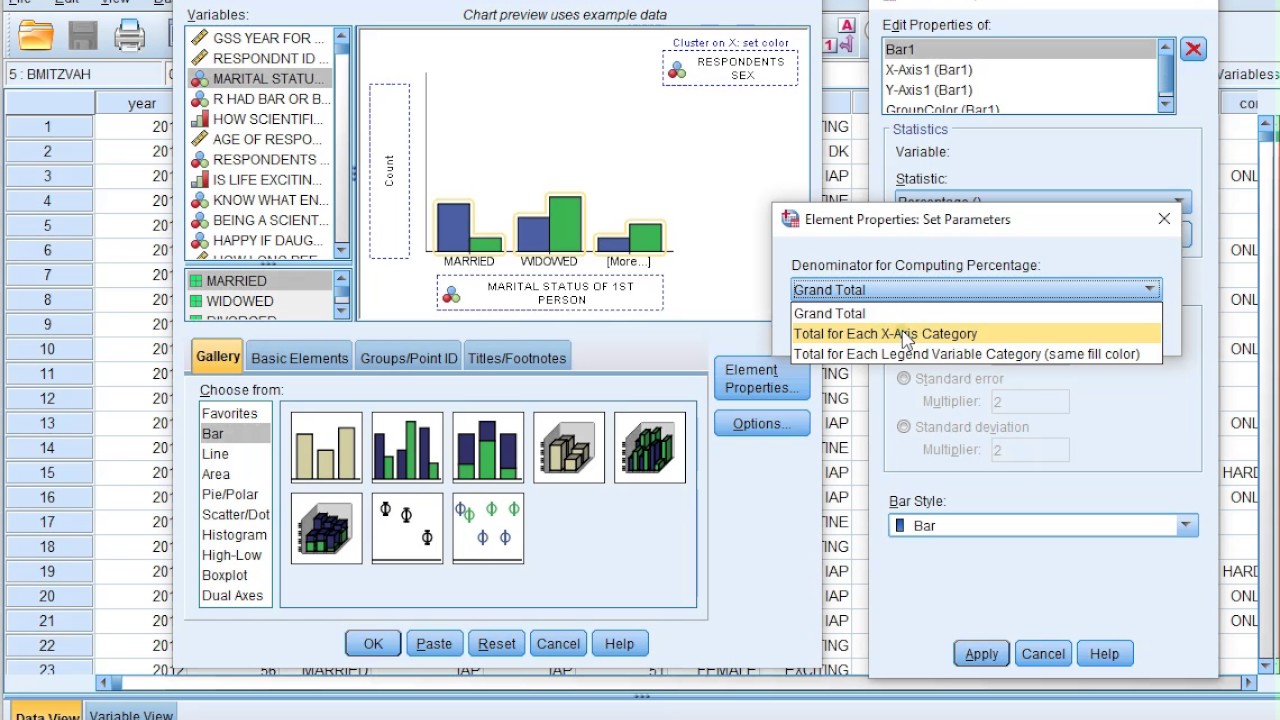
- Input Data Selections
Depending on your graph type, select the variables or data you wish to visualise.
- Advanced Statistical Models
For more advanced research, SPSS provides tools for regression, ANOVA, non-parametric tests, and more. As with basic tests, select your analysis type from ‘Analyze’ and choose the relevant variables.
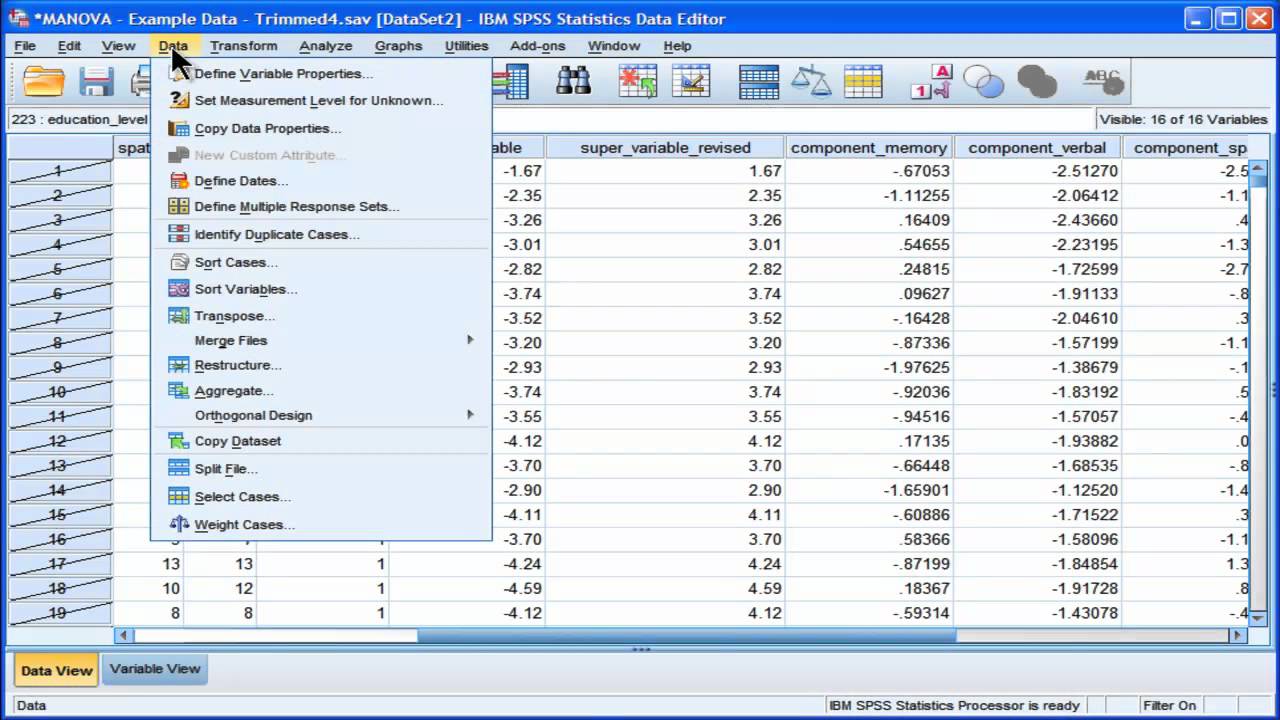
- Saving and Exporting Data
Remember to routinely save your SPSS data analysis project. The software also allows you to export results in multiple formats, facilitating easy sharing and integration into academic papers.
Conclusion
IBM SPSS is an invaluable asset for academic researchers. With its myriad of statistical tools, it offers rigorous analytical capabilities, making data interpretation both effective and efficient. To master it, regular practice and exploration of its features are key.
If you’re seeking further guidance on how to utilise SPSS or need specialised assistance with your research project, contact us at ProScholars.